If you are running a small business and currently using a @gmail.com address, check out our new Virtual Email Hosting service. It maps a custom email address onto your existing Gmail mailbox, so you get to send and receive emails using the new address whilst keeping the same Gmail mailbox — no migrations needed.
Maths is a subject that can be difficult to teach, but with the right tools, it can be made easier. This article will discuss some of the best tools for tutoring math online, and how they can help teachers to improve their student’s skills.
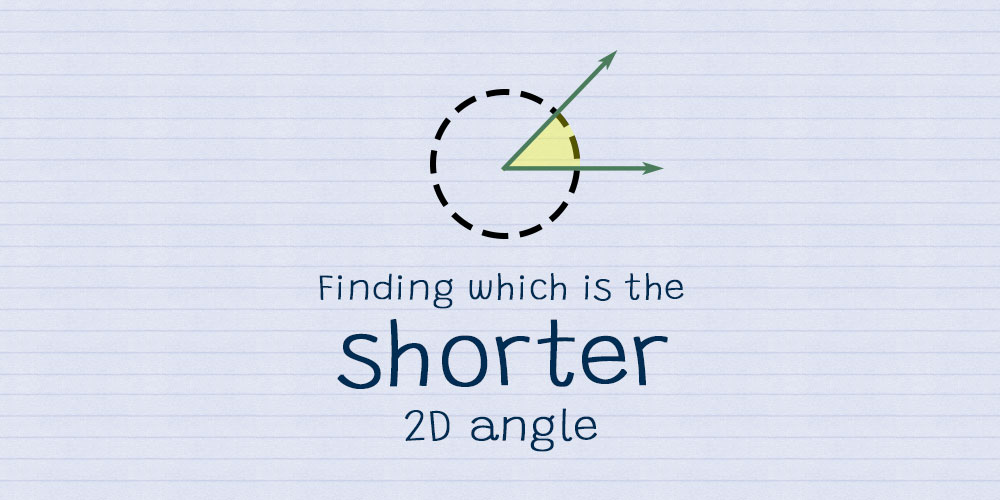
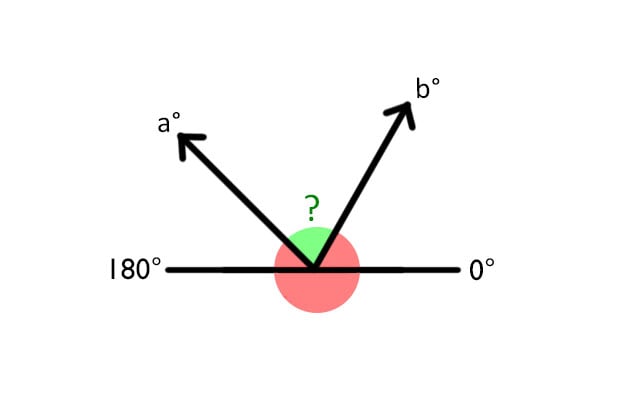
Here’s a really simple math problem in 2D games development that has a surprisingly complex solution. If I were to give you angles a and b, how would you calculate 1) the direction — that is, clockwise being positive; and anti-clockwise being negative — and 2) magnitude of the shorter angle of rotation from a to b?
We want the angle in green.
When you visualise it, both values seem so obvious; which was why I was so surprised I couldn’t figure it out. On the surface, it seems really simple — if you just take b – a, doesn’t it give you the solution?
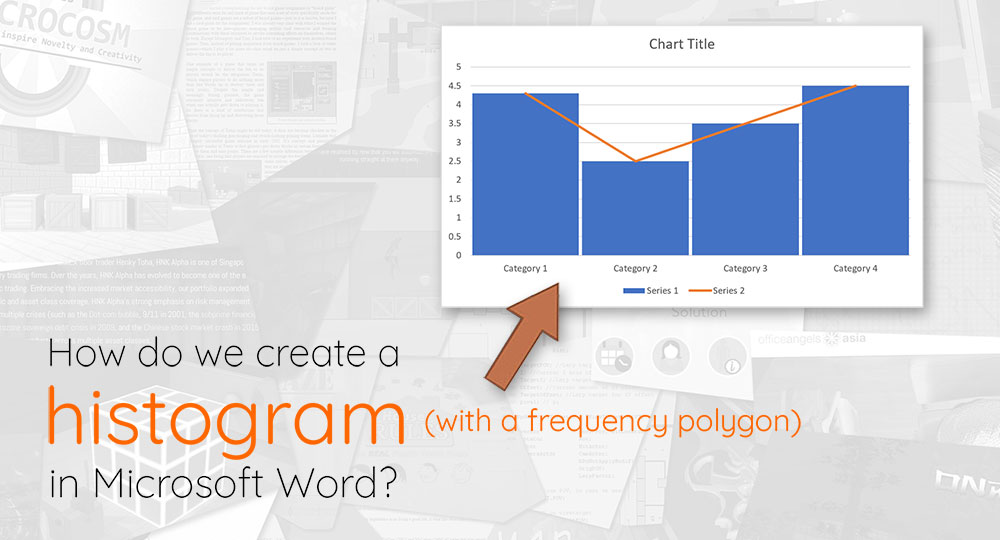
Microsoft Word has a bevy of powerful chart-making tools, capable of creating almost any kind of graph or chart that one can imagine. The way to create some of these charts are not immediately obvious, however, and one of these kinds of charts is the histogram (with an accompanying frequency polygon).
Are you tearing your hair out trying to figure out how to create a bar-line chart (i.e. a combination of a bar chart and a line chart) in Microsoft Word? Look no further, we’ve got step-by-step instructions for you in this post, as well as an accompanying video guide.
Most programming languages come with native functions that help us round our numbers, either upwards (i.e. ceiling operation), downwards (i.e. floor operation), or to the nearest whole (i.e. round operation). While this is convenient, we sometimes need a bit more than that — what if — for example — we want to round our numbers to the nearest 0.5, or the nearest 3rd?
As a result of working on upgrades for this Pokémon Effort Value Calculator, math has been a pretty big part of my life for the past few months, as I’ve been rearranging the games’ formulas for stat and damage calculation to make my own that fit my needs.
One such formula was the EVs needed one, which gives you the amount of EVs you need to invest to raise a stat by n points. Everyone knows that at Level 100, you get 1 stat point for every 4 EV points you invest; but what happens when you’re not at Level 100, or when you factor in stat modifiers like Nature, or item and ability boosts?
Polar movement, i.e. moving objects at an angle, is something that people starting out in games programming often have trouble with. Coordinate systems are easy to understand, and so is moving things left and right or up and down; but what if you want to move at angles that are not parallel to an axis, like 30° upwards, or towards a target? How do you get a vector that represents that direction of movement?
If you’re making your foray into games programming, vectors are an important concept that you’ll have to understand and work with. If you’ve been reading build-your-own-game tutorials and getting confused by all the vector math that’s been going on, this article is probably a good one to read.